This one, from Flinn Scientific, is a poster that they sell. It suggests that the indicators have very distinct color changes rather than fading one color into the other - something that isn't quite perfectly true.
This one about.com's chemistry domain shows color changes for indicators that you could eat. Honestly, you could eat the indicators listed above. You just shouldn't.
Here's a phenomenally comprehensive chart from the pH Ranges and Color Changes of Kodak Indicators, a chart that I wish I'd gotten a copy of.
Boundless.com has a less visual but maybe more web-friendly chart.
Some professor at California State University - Dominguez Hills posted this graphic which I like but would like even more if it had a little higher resolution.
CNX.org (no, I've no clue what that site is either) has a nice chart posted as part of a lab experiment instruction there.
Mel Anthony Pepioto uploaded a slide show with this graphic on slide 54 - though I doubt whether he made it himself.
Along the same vein, Mohammed Mohsin's slide 11 has this chart.
Finally, slide 15 of Then Murugeshwari's presentation has another edible indicator color chart.
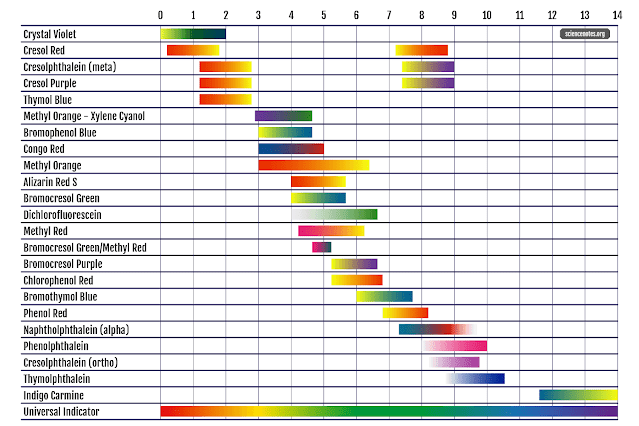
...and one more addition from ScienceNotes.org because it includes universal indicator at the bottom...


No comments:
Post a Comment